

Oct 4, 2024
Original Problem: \(\frac{53}{36} \approx 1.472\) dice on average
Extra credit: \(\frac{17357555}{5038848} \approx 3.445\) dice
Explanation:
Consider the general case for rolling \(N\) \(M\)-sided fair dice at once (the rolls are independent of each other). By the rules of the game, after the first iteration of rolls, one can set aside anywhere between \(\lceil\frac{N}{M}\rceil\) (by the pigeon-hole principle) to \(N\) dice. Since each of those occurences are mutually exclusive, the average number of dice set aside is simply the following:
\begin{align} \sum_{k = \lceil\frac{N}{M}\rceil}^{N} k \times P(M, k) \\ \end{align}
Where \(P(M, k)\) denotes the probability of setting aside \(k\) \(M\)-sided dice after the first iteration of \(N\) rolls.
Let's go back to the original problem. Here, we have \(M = 6\) and \(N = 3\). \(N\) is small enough that we can analyze case by case, so we will do that.
For simplicity of counting, we will assume that each die is distinct. Thus, the total different dice rolls we can have here is \(6^3 = 216\). For \(k = \lceil\frac{3}{6}\rceil = 1\), we need to have each of the three dice showing a different number. There are \(6 \times 5 \times 4 = 120\) different permuations. Thus, \(P(M = 6, k = 1) = \frac{120}{216} = \frac{5}{9}\).
For \(k = 2\), we have 6 choices for the pair of dice showing the same number, and 5 choices for the odd one out. We also have three different positions to slot the odd-one-out die, therefore amounting to \(6 \times 5 \times 3 = 90\) different permutations. Thus, \(P(M = 6, k = 2) = \frac{90}{216} = \frac{5}{12}\).
Finally, for \(k = N = 3\), we have 6 choices for all three dice showing the same number. Thus, \(P(M = 6, k = 3) = \frac{6}{216} = \frac{1}{36}\).
We note that \(120 + 90 + 6 = 216\), thus we cover all the cases here.
Hence, the average number of dice we set aside is:
\begin{align} &\sum_{k = \lceil\frac{N}{M}\rceil}^{N} k \times P(M, k) \\ \\ =& \sum_{k = 1}^{3} k \times P(6, k) \\ \\ =& \frac{1 \times 120 + 2 \times 90 + 3 \times 6}{216} \\ \\ =& \frac{318}{216} = \boxed{\frac{53}{36}} \\ \\ \approx& 1.472 \end{align}
For extra credit, when have \(M = 6\) and any arbitrary \(N\), there are too many cases to cover manually. As a result, I resorted to Monte-Carlo simulations, as shown in the following graphs.
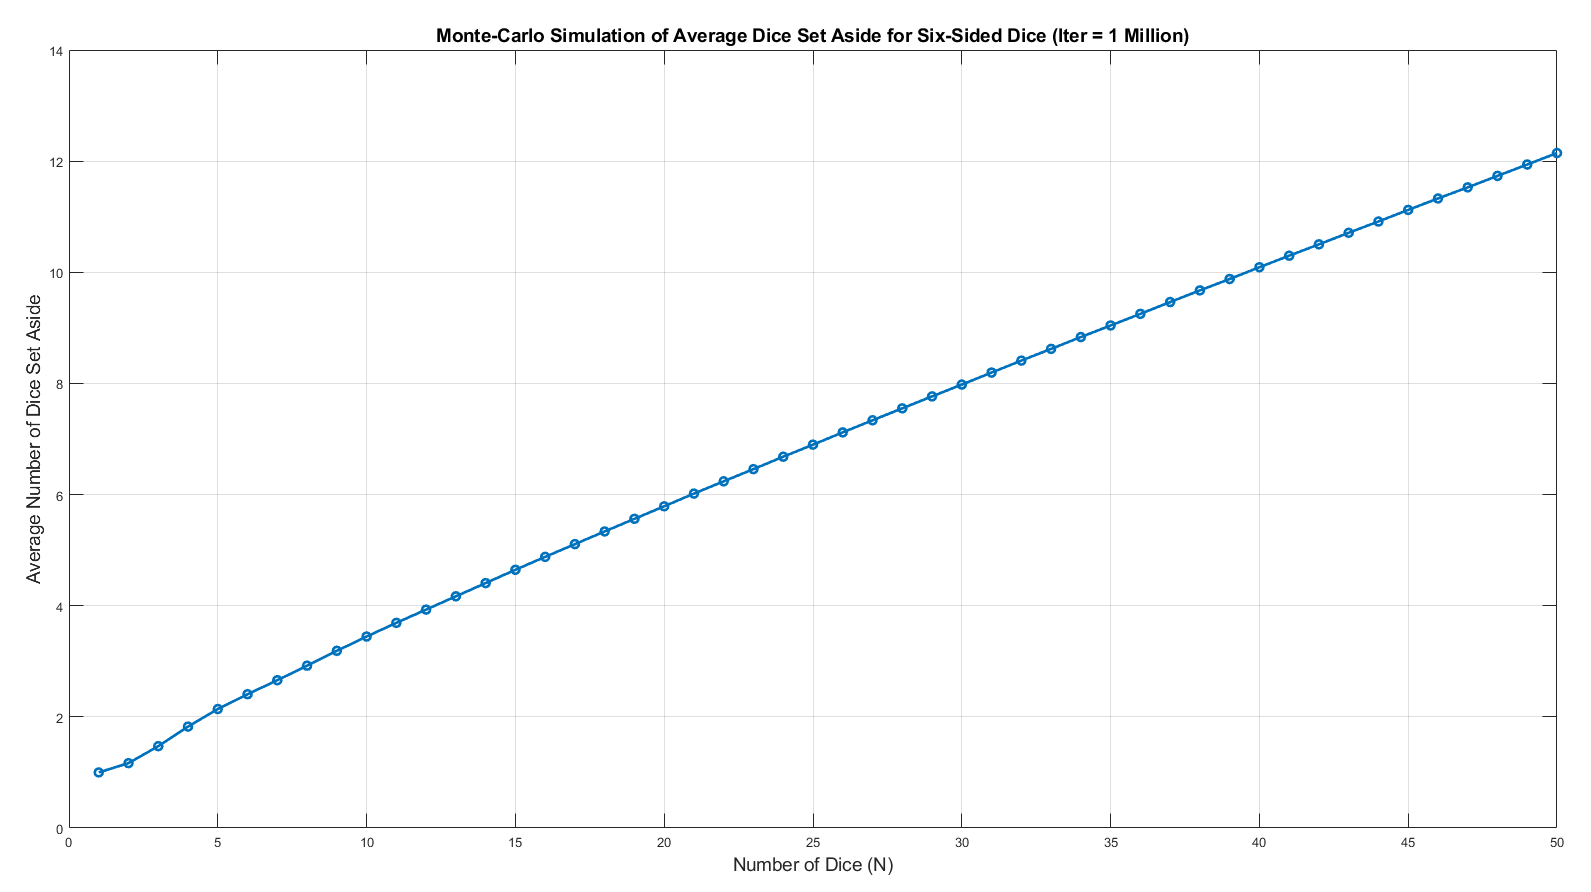
Below is a graph of the average number of 6-sided dice set aside for \(N\) up to 50. It is interesting to note that the graph appears to be linear after \(N = 5\).

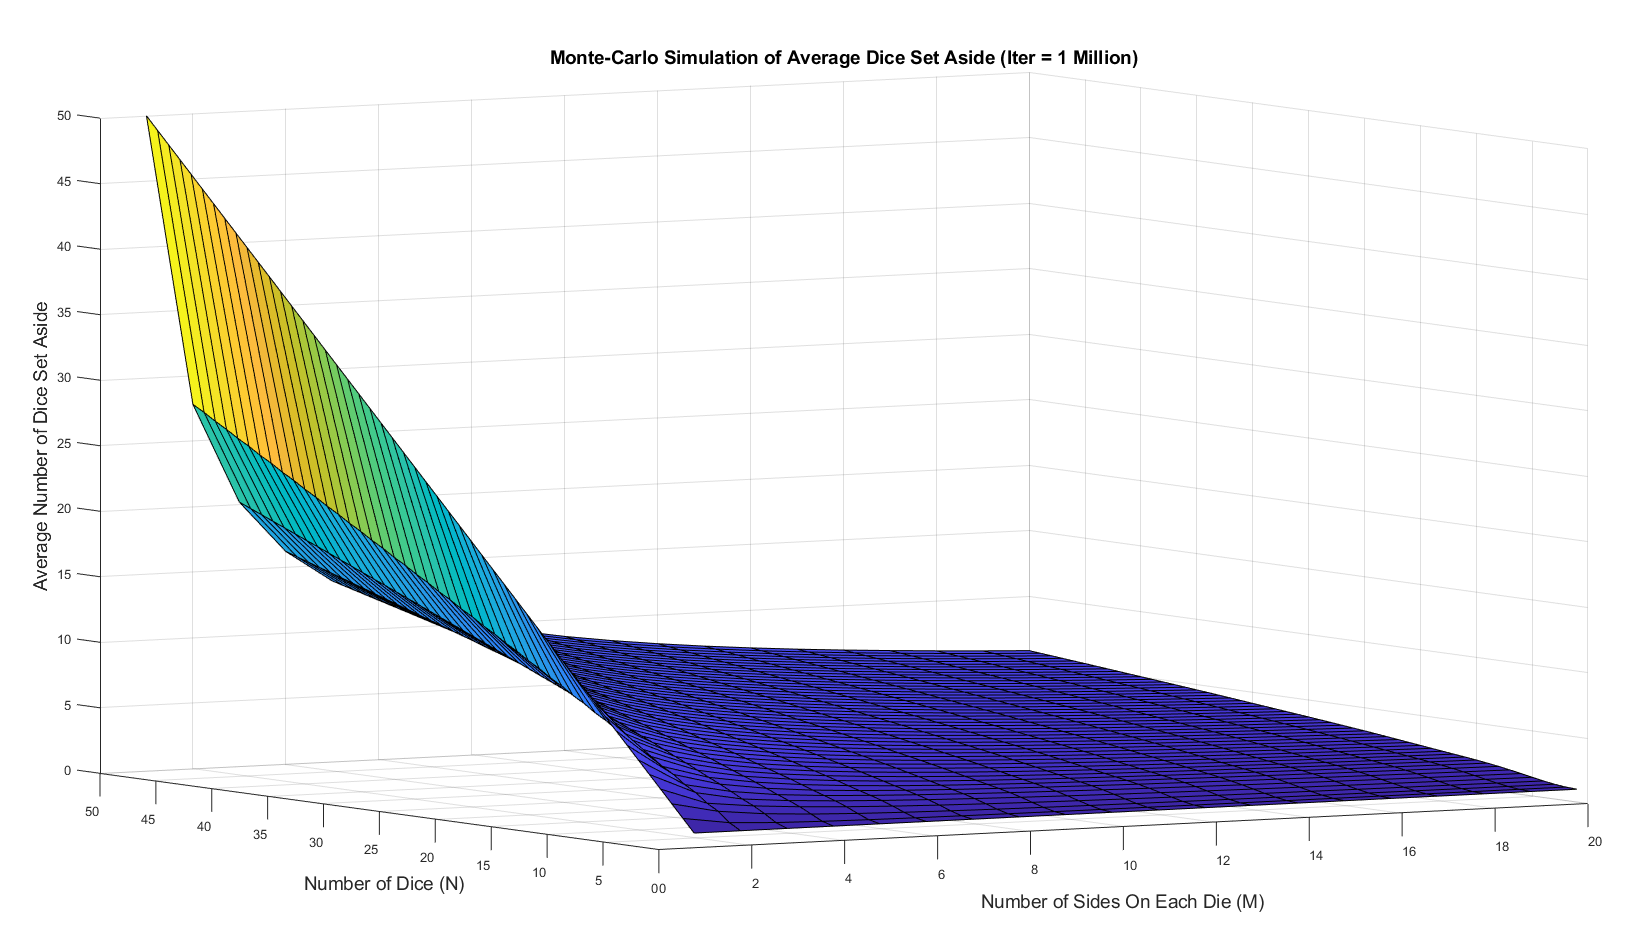
Out of curiosity, I created a surface plot showing the average number of dice set aside for \(M\) going from 1 to 20 (D20 for all you Dungeons & Dragons fans) for \(N\) up to 50, once again done with 1 million simulations. As \(M\) increases, the number of dice set aside rapidly drops, which is not surprising since with fair dice rolls, no number tends to stand out over others.

Now let's go back to the extra credit setup of \(N = 10\) and \(M = 6\). In this section, I will derive an exact solution to the Tenzi problem. First, what are our bounds for \(k\)? Well, applying the analysis from earlier, \(k\) ranges from \(\lceil\frac{10}{6}\rceil = 2\) to \(N = 10\). Again, for simplicity of counting, let us assume each die is distinct. Then, we have a total of \(6^{10} = 60466176\) distinct rolls (that's more than 60 million). Let's analyze how many rolls amount to \(k\) dice set aside.
We observe that for \(k \ge 5\), we don't care about the results of the remaining dice rolls as \(k\) will be the most or tied for the most frequent number of dice we would set aside. Thus, for each of those \(k\) values, we have 6 choices for the common dice value of the \(k\) dice we set aside, and each of the remaining dice has 5 choices. We also have \(\binom{10}{k}\) ways to position each of the \(k\) dice. Denote \(f(k)\) as the number of distinct positions of the 10 dice rolls in which we set aside \(k\) dice, for \(k \ge 5\), we have:
\begin{align} f(k) = 6 \times 5^{10 - k} \times \binom{10}{k} \end{align}
Evaluating \(f(k)\) for \(5 \leq k \leq 10\), we have:
\begin{align} f(6) &= 6 \times 5^4 \times \binom{10}{6} = 787500\\ \\ f(7) &= 6 \times 5^3 \times \binom{10}{7} = 90000\\ \\ f(8) &= 6 \times 5^2 \times \binom{10}{8} = 6750 \\ \\ f(9) &= 6 \times 5^1 \times \binom{10}{9} = 300 \\ \\ f(10) &= 6 \times 5^0 \times \binom{10}{10} = 6 \\ \end{align}
One tiny correction is that for the \(k = 5\) case, we are double counting the 5-5 pattern, since they are represented twice for each of the first choice for \(k\). Therefore, we have to remove the double-counted portion, which amounts to \(\binom{6}{2} \times \binom{10}{5} = 3780\).
This means that \(f(5)\) is actually equal to \(6 \times 5^5 \times \binom{10}{5} - 3780 = 4721220\).
The good news is that this took care of 6 out of the 9 possible values for \(k\), but the bad news is that they only consist of 9.28% of the total possible scenarios. In other words, more than 90% of the cases will have \(k\) equal to 2, 3, or 4. Let's look at those cases now.
For \(k = 4\), we are going to approach this indirectly. The total number of possible scenarios with 4 dice showing the same value is \(6 \times 5^6 \times \binom{10}{4} = 19687500\), but this does not equal to \(f(4)\) because the remaining dice cannot be arbitrary. The forbidden cases are with at least 5 of the remaining 6 dice showing a same value that's different from the one shown by the 4 dice. We will evaluate how many scenarios there are and subtract them from the total number of possible scenarios.
There are two possible patterns: 4-6 and 4-5-1. For the 4-6 pattern, the total number of scenarios is just \(6 \times 5 \times \binom{10}{4} = 6300\), i.e. 6 choices for the 4-dice value, then 5 choices for the 6-dice value, and then \(\binom{10}{4}\) ways to arrange the initial 4 dice. For the 4-5-1 pattern, there are 6 ways to choose the odd-one-out die and 5 ways to assign it a value, then the remaining 4 ways to assign the remaining 5 dice. There are still \(\binom{10}{4}\) ways to arrange the initial 4 dice. In total, that yields \(6^2 \times 5 \times 4 \times \binom{10}{4} = 151200\) total scenarios.
However, we have to be careful here. Since we tackled \(f(4)\) indirectly, there is a case where we double-counted, namely the 4-4-x pattern! Why? This is analogous to the 5-5 pattern when \(k = 5\). We are double-counting the case where the remaining 6-dice can have a group of 4-dice that's considered the "other" choice, but from that group's perspective, it is our first choice of 4-dice that's the "other" choice! So this double-counting must be addressed. In total, we have \(\binom{6}{2}\) ways of picking the two dice values to be the two groups of 4-dice that we double counted (since the way the two values are picked is exactly twice of that), \(\binom{10}{4}\) ways of positioning the first group of four and \(\binom{6}{4}\) ways for the second group. Finally, the last two positions can be any of the remaining 4 values for a total of \(\binom{6}{2} \times \binom{10}{4} \times \binom{6}{4} \times 16 = 756000\) scenarios we double-counted.
Therefore, \(f(4) = 19687500 - 6300 - 151200 - 756000 = 18774000\).
We will ignore \(f(3)\) as that is the case yielding the most number of distinct scenarios and obtain it indirectly by evaluating \(f(2)\). For \(f(2)\), note that the most frequent dice has a count of 2. This means we only have the following possible patterns: 4 pairs and 5 pairs, as fewer pairs are not possible since they would leave the remaining dice a greater number than the available values to choose from.
For 4 pairs, we have \(\binom{6}{4}\) ways of selecting the values representing the pairs and \(\binom{10}{2}\) ways of choosing the first pair's positions, \(\binom{8}{2}\) ways for the second pair's positions, and so on. Once the first eight dice have been decided, the remaining two dice have only 2 possible permutations. This yields a total of \(\binom{6}{4} \times \binom{10}{2} \times \binom{8}{2} \times \binom{6}{2} \times \binom{4}{2} \times 2 = 3402000\) scenarios.
For 5 pairs, we have \(\binom{6}{5}\) ways of selecting the values representing the pairs and \(\binom{10}{2}\) ways of choosing the first pair's positions, \(\binom{8}{2}\) ways for the second pair's positions, and so on. This yields a total of \(\binom{6}{5} \times \binom{10}{2} \times \binom{8}{2} \times \binom{6}{2} \times \binom{4}{2} \times \binom{2}{2} = 680400\) scenarios.
In total, there are \(f(2) = 3402000 + 680400 = 4082400\) distinct scenarios for \(k = 2\).
This means that \(f(3) = 6^{10} - (f(2) + f(4) + f(5) + f(6) + f(7) + f(8) + f(9) + f(10)) = 32004000\).
Finally, we can calculate the average number of dice set aside to be:
\begin{align} &\frac{\sum_{k = 2}^{10} kf(k)}{6^{10}} \\ \\ =& \frac{208290660}{60466176} \\ \\ =& \boxed{\frac{17357555}{5038848}} \\ \\ \approx& 3.4447 \end{align}
In summary, we have:
| k | f(k) |
|---|---|
| 2 | 4,082,400 |
| 3 | 32,004,000 |
| 4 | 18,774,000 |
| 5 | 4,721,220 |
| 6 | 787,500 |
| 7 | 90,000 |
| 8 | 6,750 |
| 9 | 300 |
| 10 | 6 |
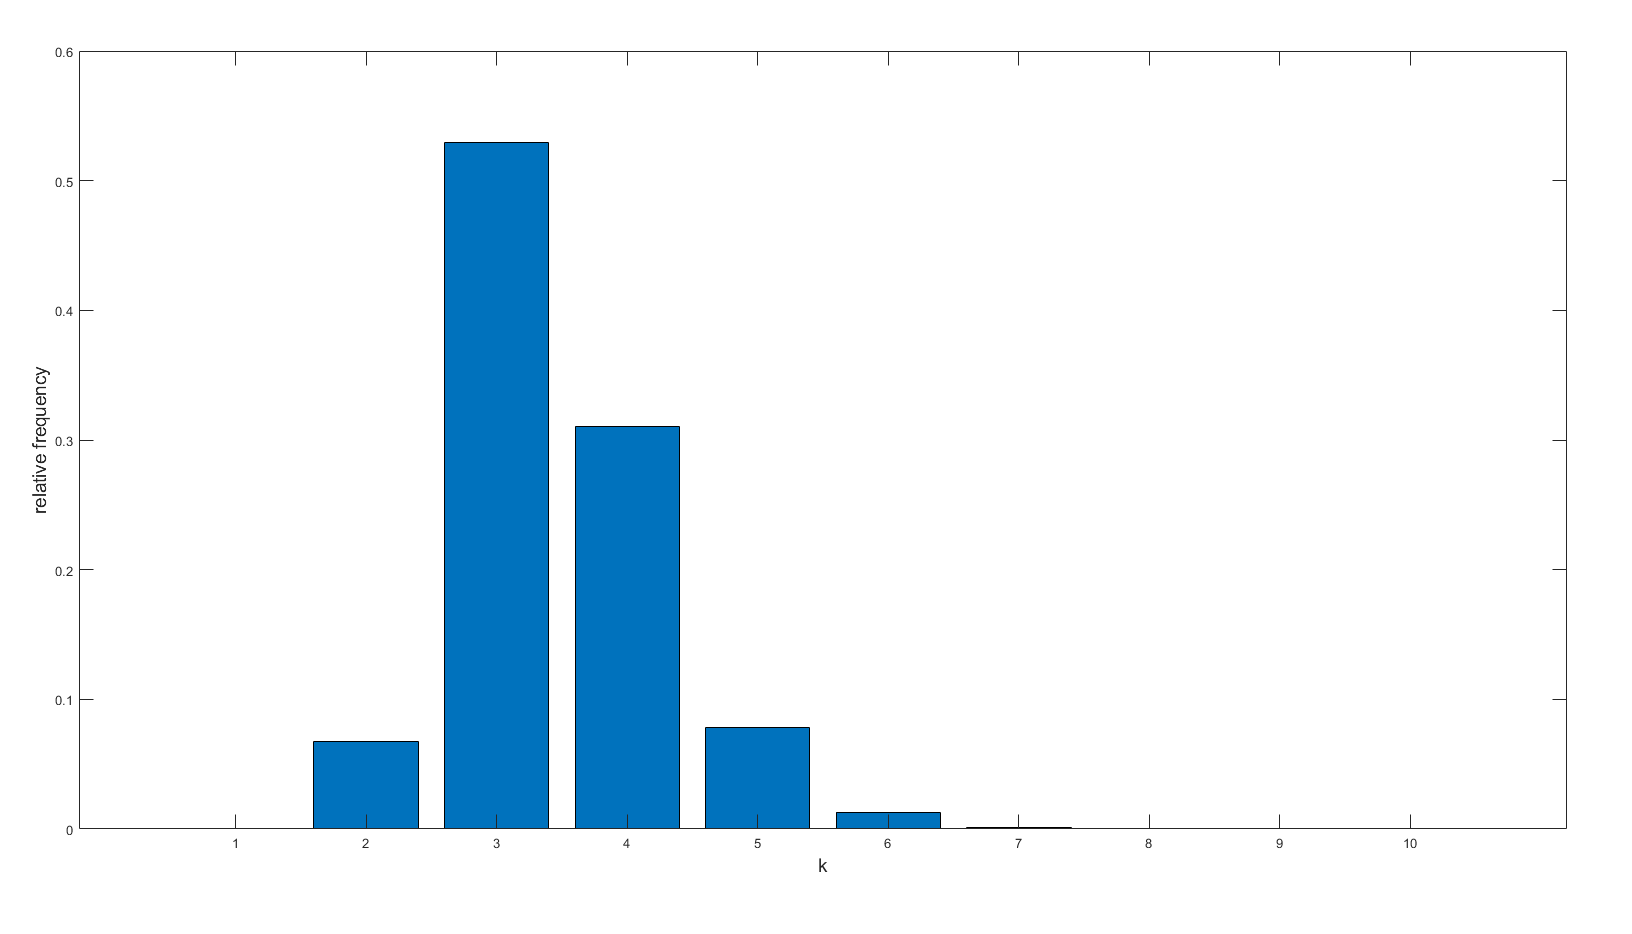
Below is a relative frequency graph of each of the possible values of \(k\) for Tenzi:
