

June 27, 2021
Riddler solitaire is played with 11 cards: an ace, a two, a three, a four, a five, a six, a seven, an eight, a nine, a 10 and a joker. Each card is worth its face value in points, while the ace counts for 1 point. To play a game, you shuffle the cards so they are randomly ordered, and then turn them over one by one. You start with 0 points, and as you flip over each card your score increases by that card’s points — as long as the joker hasn’t shown up. The moment the joker appears, the game is over and your score is 0. The key is that you can stop any moment and walk away with a nonzero score.
What strategy maximizes your expected number of points?
Extra credit: With an optimal strategy, how many points would you earn on average in a game of Riddler solitaire?
Explanation:
As George Pólya put it best from his seminal work, How to Solve It, often in order to grasp the key to the solution, solve a simpler problem first. For sake of simplicity let's call the game described in the puzzle "Joker Blackjack", because the way points are amassed is very similar to Blackjack, except you can potentially double down up to 10 cards in a deck of 11 cards with the joker. The problem may seem complex at first, but we can get a feel for how the game works by considering a simplified version. In this version, let us change all non-joker cards in the deck to be worth 1 point each. In this case, we can strategize solely based on how many cards we intend to draw from the deck, as each non-joker card is worth the same point. The game now boils down to: what's the maximum number of cards I can draw before drawing into a joker?
Since the deck is randomly shuffled, it is not hard to see that for \(1 \leq n \leq 11\), the probability that the joker is in the first \(n\) cards of the deck is \(\frac{n}{11}\). Similarly, the probability that the joker is in the pile from the \(n\)th card to the 11th card, inclusive, is \(\frac{11-n+1}{11}\). If we only intend to draw one card from the deck, our expected score would therefore be:
\begin{equation} 1 \times \frac{10}{11} + 0 \times \frac{1}{11} = \frac{10}{11} \end{equation}
This is because when we draw the first card, we either score 0 points drawing the joker with probability of \(\frac{1}{11}\) or score 1 point with probability \(1 - \frac{1}{11}\) by drawing any other card. We can therefore generalize: denote \(f(n)\) as the function for expected score when intending to draw the first \(n\) cards of the deck. Our expected score in this simplified Joker Blackjack would be:
\begin{align} f(n) &= n \times \left(1 - \frac{n}{11}\right) + 0 \times \frac{n}{11}\\ &= \boxed{\frac{n(11-n)}{11}} \end{align}
Of course, this is valid for \(n = 1, 2, 3, \dots, 10\). We don't want to draw the whole deck as for sure we will hit the Joker!
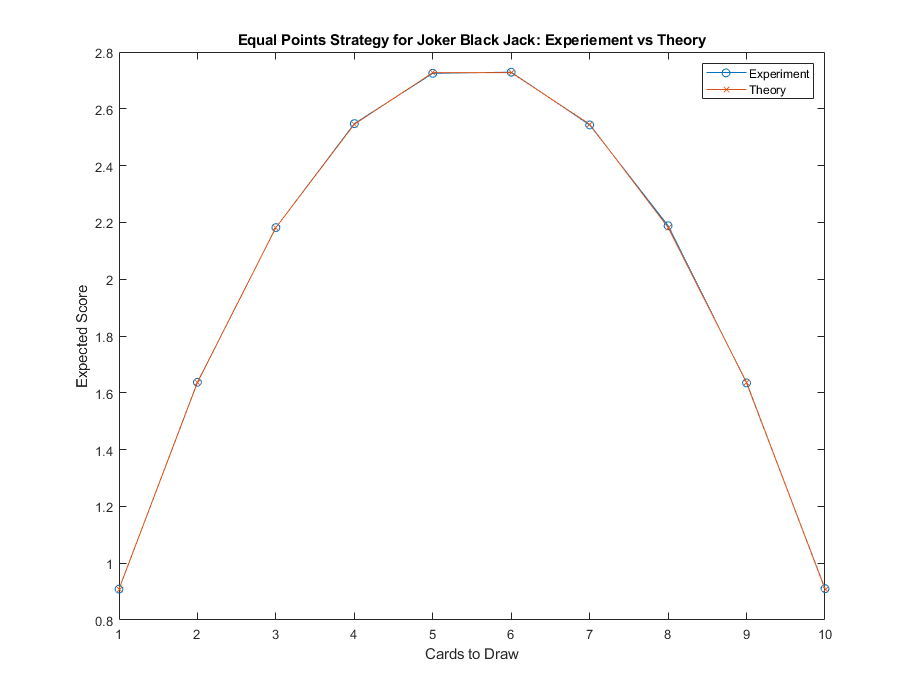
Since \(n\) is an integer, we can easily verify that the values that maximize \(f(n)\) is \(n = 5, 6\), for which the maximum expected score here would be \(\frac{30}{11} \approx 2.727\).
Yes, I simulated just for sanity check via Monte-Carlo with 1 million trials:

Following the insights from the equal-points simplification, we now add back the point values. If we still pursue a card-based strategy, what's the optimal number of cards to draw and obtain the maximum score? It turns out, for a randomly shuffled deck, the average value of values across any set size is the same! In other words, pick randomly any number between 1 to 10, without replacement. Do this \(k\) times for \(k = 1, 2, \dots 10\), the average of the average values for the set of \(k\) numbers will converge to the average of the 10 numbers, which is 5.5, as you sample this many, many times. This is result of the Central Limit Theorem on the mean of the sampling distribution.
What does this imply to our solution? Well consider we intend to draw \(n\) cards as our strategy. If the non-joker cards are worth 1 point each, then we've already seen that the expected score is \(\frac{n(11-n)}{11}\). However, now that the points are different, the expected score will be the average of the \(n\) cards we draw for the case that the joker is not in one of those \(n\) cards. In this case, the average can be any subset of \(n\) numbers from 1 to 10 inclusive, but from the Central Limit Theorem, in the long run that average will be 5.5, regardless of the value of \(n\). Therefore, the expected score for this strategy, denoted \(g(n)\) is actually:
\begin{align} f(n) &= 5.5n \times \left(1 - \frac{n}{11}\right) + 0 \times \frac{n}{11}\\ &= \boxed{\frac{5.5n(11-n)}{11}} \end{align} For \(n = 1, 2, 3, \dots, 10\).
Which means, again for \(n = 5, 6\), we obtain the optimal score for our original Joker Blackjack game.
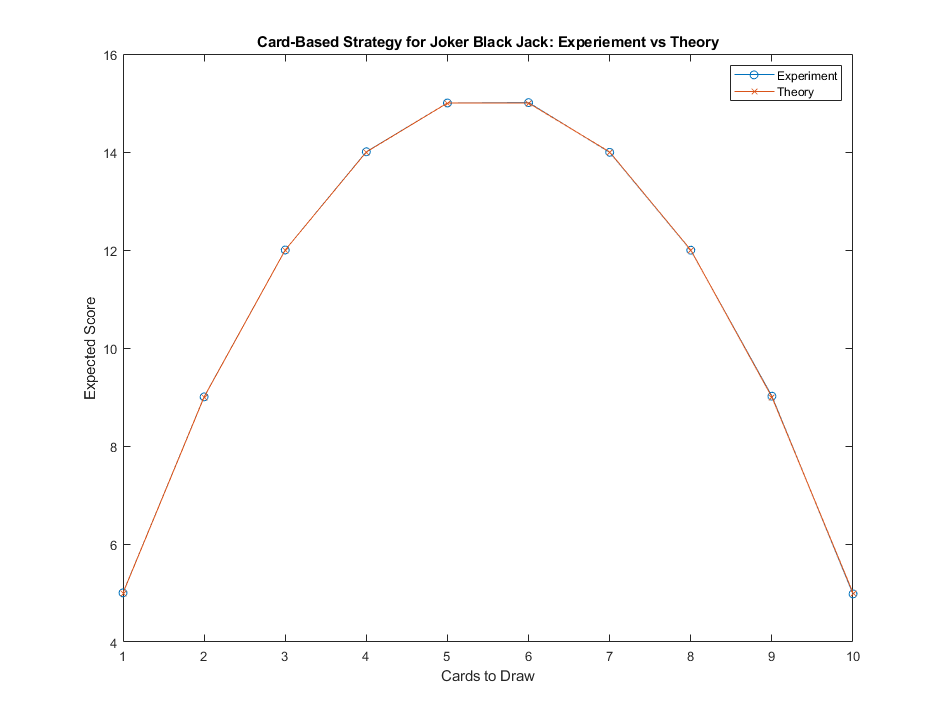
\begin{align} f(5) = f(6) &= 5.5n &= \frac{(5.5)(5)(6)}{11} \\ &= \frac{55}{10} \frac{30}{11} \\ &= \boxed{15} \end{align}
As usual, I simulated the card-based strategy as below using Monte-Carlo with 1 million trials:

The question is now: can we do better? It seems that the card-based strategy is too restrictive, as we want to draw more cards when the first few cards we've drawn are of lower value, and draw fewer cards in the other scenario. This is so that we can optimize for the trade-off between drawing more cards to increase our score and increasing the chance of drawing into the joker. This can be achieved with a score-based strategy, whereby we pick a target score instead of number of cards to draw such that once we hit or exceed that score, we stop drawing.
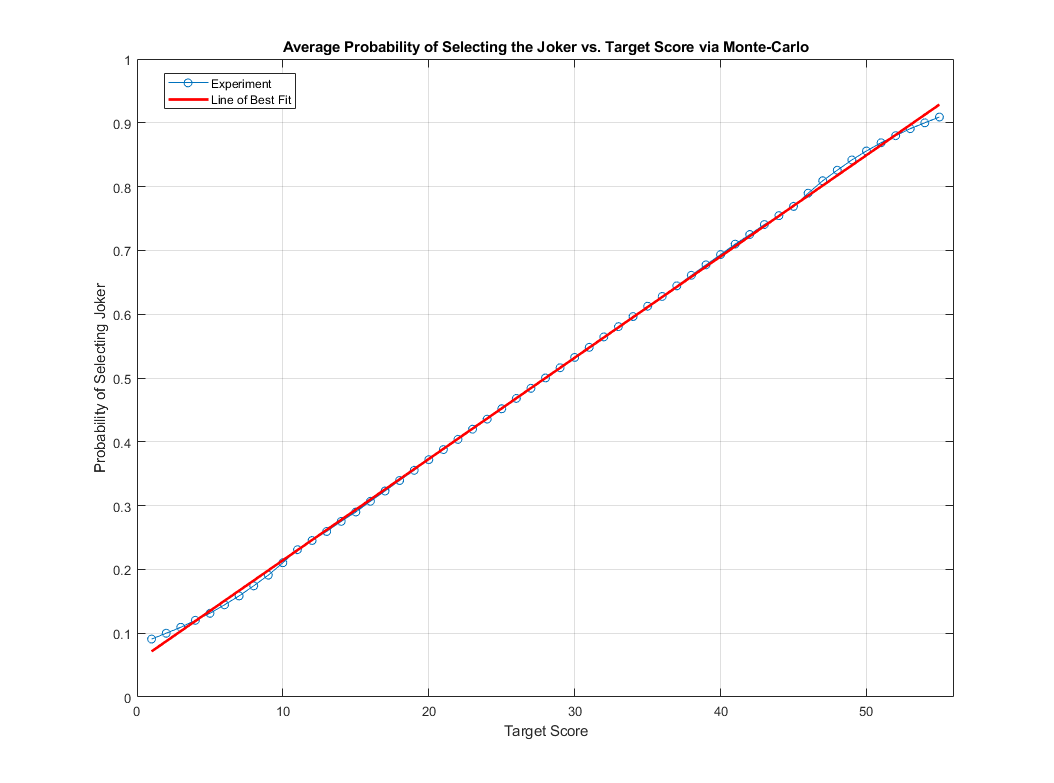
Let us denote \(p(s)\) as the probability of drawing the joker (and hence getting a score of 0) using this strategy with a target score of \(s\). Clearly, our expected score would be \((s + \epsilon)(1 - p(s))\) where the \(\epsilon\) represents the residual "bonus" score we would get as our last drawn card might exceed, and not just hit, the target score. Computing \(p(s)\) might be difficult analytically, as the ways to add up the score increases as we hit the "middle" sum values such as 28 (keep in mind the maximum score we can get is \(1 + 2 + \dots + 10 = 55\)). Clearly, \(p(1) = \frac{1}{11}\) since we would only draw the joker if it's the first card, and \(p(55) = \frac{10}{11}\) as the only way we would avoid the joker would be if it were the final card. However, everything in between I will simulate:

With Monte-Carlo of 10 million trials, it appears that \(p(s)\) is a linear function! Sure at the tail ends there are some fluctuations, but in the middle, it almost follows a line! With line of best fit, we can approximate \(p(s)\) as:
\begin{equation} \boxed{p(s) = 0.01587s + 0.0556} \end{equation} For \(s = 1, 2, \dots, 55\).
Below is with line of best fit:

The middle part of the experiment fits almost exactly with the line of best fit. This is important because since \(p(s)\) is a line, we just need to optimize our strategy by selecting the value of \(s\) that maximizes \((s + \epsilon)(1 - p(s))\), which in this case would be when \(1 - p(s) = 0.5\), i.e. when \(p(s) = 0.5\). This is achieved when \(s = 28\), the half way point between 1 and 55. In other words, if we set our target score to be 28, we optimize our scores and on average expect:
\begin{equation} (28 + \epsilon)(1 - p(28)) = (28 + \epsilon)(0.5) = 14 + \epsilon_2 \end{equation}
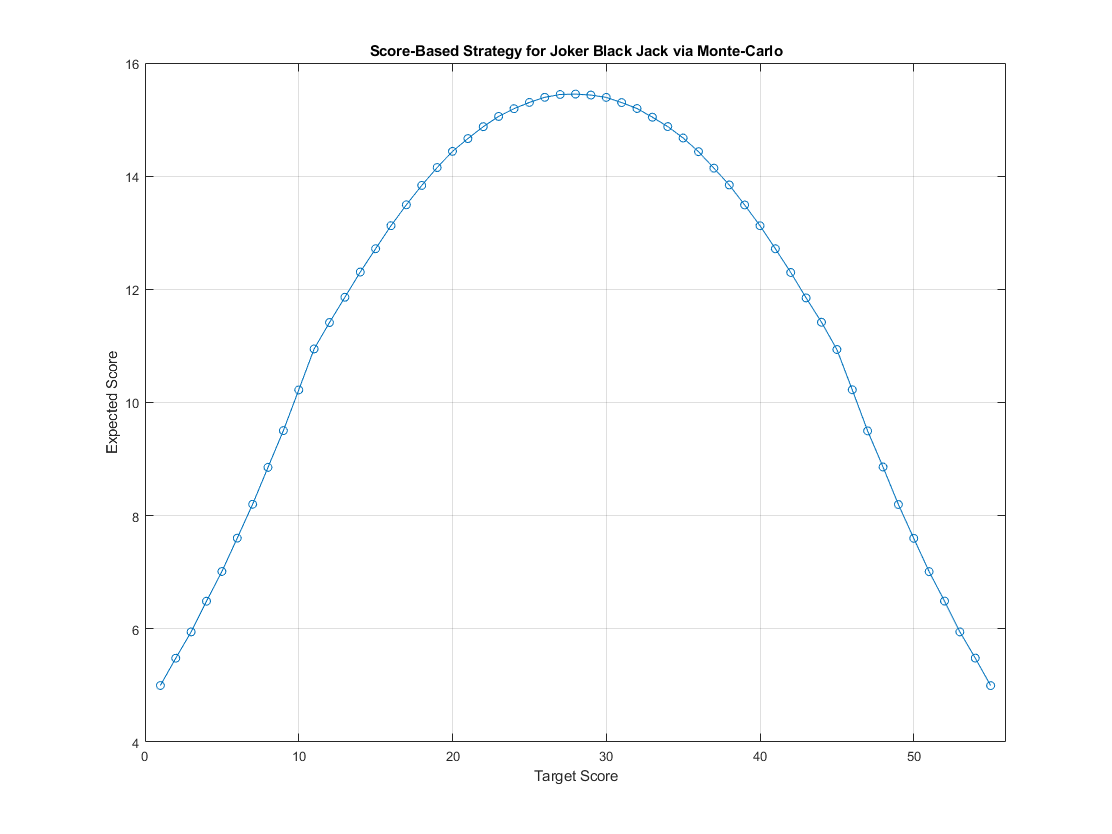
Wait...this is no better than our card-based strategy in which the optimal result obtained there was 15! Well, it turns out that the trade-off between increasing our points and increasing the chance of drawing the joker is such that the optimal score-based strategy is to pick the midpoint of the possible scores. This yields to roughly the same optimized expected score of around 14-15 point range as compared to its middle-card counterpart. However, since we can "overshoot" our target score, the \(\epsilon_2\) actually makes a difference when I ran Monte-Carlo on the scored-based strategy with 10 million trials, yielding a slightly higher score than 15 for \(s = 28\):

Value at \(s = 28\) is \(\boxed{15.45}\) for the Monte-Carlo result.
This is slightly better than to integer-relaxed optimized value of the card-base strategy, which is \(5.5^3 / 11 = 15.125\).
The takeaway message is: double down halfway for Joker Blackjack!
There is an expression for the analytic solution for the expected score when employing the optimal strategy, which is to double-down if your actual score has yet to reach 28 points. The expression first involves realizing that this strategy entails you drawing at minimum 4 cards and at maximum 7 cards. To see this, consider the fact that you drew 3 cards: 10, 9, and 8. In doing so your score is 27, so you still need to draw at least one more card to reach or exceed the target score of 28. Similarly, the minimum possible score for drawing the first 7 cards, assuming the joker isn't in there, is \(1 + 2 + \dots + 7 = 28\), and so you will be guaranteed to reach the target score drawing 7 cards.
With this in mind, let us denote \(c_n(s)\) as the number of ways to reach a score of \(s\) points drawing exactly \(n\) cards, for \(n = 4, 5, 6, 7\), with order, while drawing the first \((n-1)\) cards does not yield a score greater than or equal to 28 (otherwise we wouldn't need to be drawing card \(n\)). Remember that when drawn \(n\) cards, the probability of NOT drawing a joker is \(\frac{11-n}{11}\), and the total number of ways \(n\) cards can be drawn without the joker is \(\binom{10}{n}\). Hence we have:
\begin{equation} \text{Expected Optimal Score} = \sum_{n=4}^7 \sum_{s=28}^{55} s \left(\frac{c_n(s)}{n!\binom{10}{n}}\right) \left(\frac{11-n}{11}\right) \end{equation}
Computing the above, we get an EXACT value of:
\begin{align} &\text{Expected Optimal Score}\\ &= \left(\frac{7}{11}\right)\left(\frac{28\times216 + 29\times144 + 30\times120 + 31\times72 + 32\times48 + 33\times 24 + 34\times24}{5040}\right) \\ &+ \left(\frac{6}{11}\right)\left(\frac{28\times 2400 + 29\times 2088 + 30\times 1824 + 31\times 1512 + 32\times 1224 + 33\times 864 + 34\times 624 + 35\times 408 + 36\times 216 + 37\times 72}{30204}\right) \\ &+ \left(\frac{5}{11}\right)\left(\frac{28\times 7200 + 29\times 8040 + 30\times 7560 + 31\times 7560 + 32\times 6600 + 33\times 6480 + 34\times 4920 + 35\times 3960 + 36\times 2520 + 37\times 1320}{151200}\right) \\ &+ \left(\frac{4}{11}\right)\left(\frac{28\times 5040 + 29\times 4320 + 30\times 7200 + 31\times 8640 + 32\times 9360 + 33\times 10080 + 34\times 10800 + 35\times 9360 + 36\times 7920 + 37\times 5040}{604800}\right) \\ &= \left(\frac{7}{11}\right) \left(\frac{80}{21}\right) + \left(\frac{6}{11}\right) \left(\frac{1429}{126}\right) + \left(\frac{5}{11}\right) \left(\frac{736}{63}\right) + \left(\frac{4}{11}\right) \left(\frac{59}{14}\right) \\ &= \boxed{\frac{10709}{693}} \\ &\approx 15.4531 \end{align}